> ## Documentation Index
> Fetch the complete documentation index at: https://docs.testsprite.com/llms.txt
> Use this file to discover all available pages before exploring further.
# Test Report & Export
> Read the report page — pass rate, failure distribution, and AI recommendations — and download a PDF you can hand to a PM, to leadership, or attach to a release.
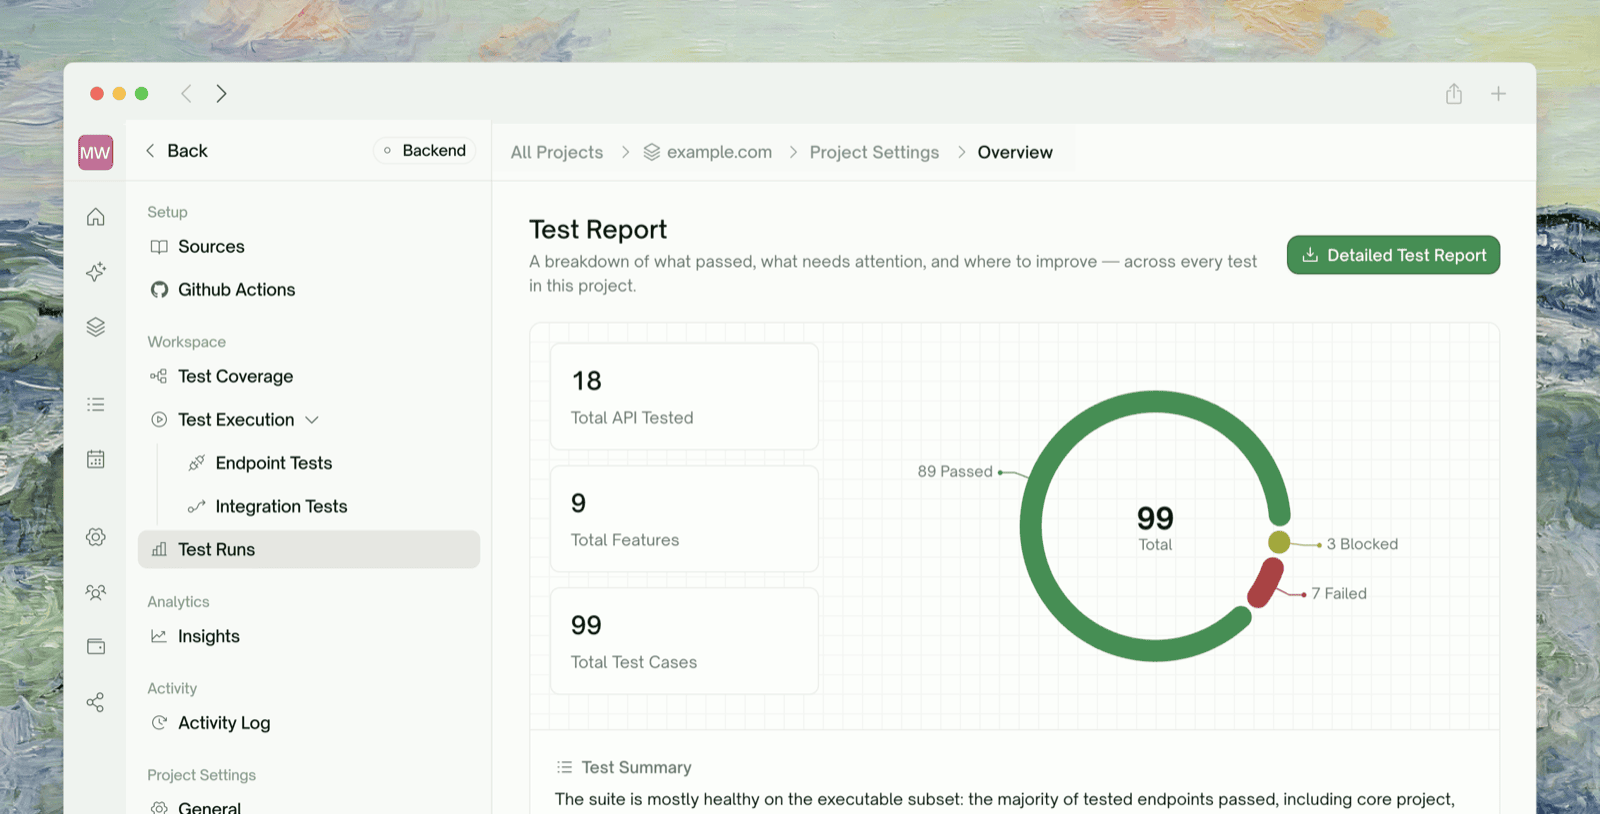
Every run produces a **report**: the pass-rate donut, the failures grouped by root cause, an AI-written summary, and a copy-paste fix prompt for your coding agent. Read it in the portal for triage, or download the **PDF** — a cover page, executive summary, and per-failure detail — to hand to a PM, to leadership, or to attach to a release record.
 ## Where to Find It
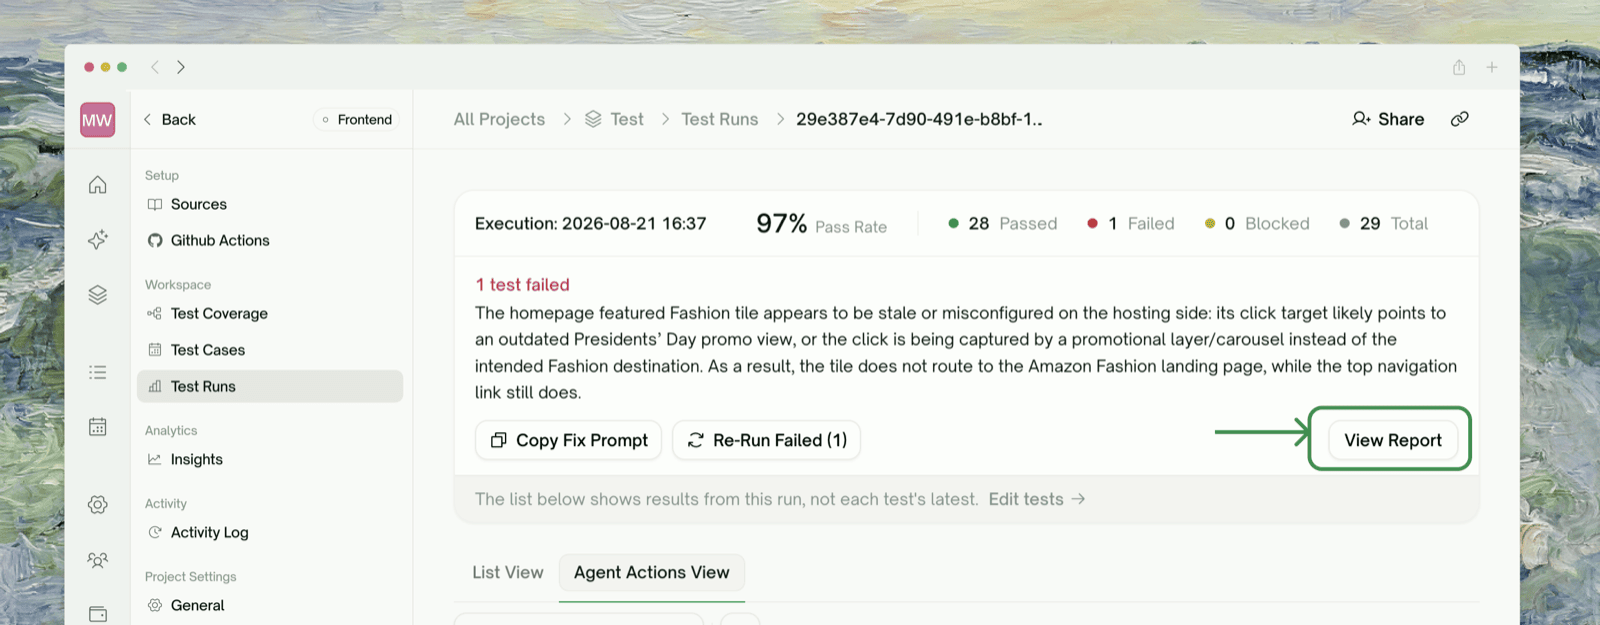
The report opens from a run's page: click View Report on a run in Test Runs. It reflects the run you opened it from.
## Where to Find It
The report opens from a run's page: click View Report on a run in Test Runs. It reflects the run you opened it from.
 The report is generated from an AI **analysis pass** that runs automatically when a run finishes. While it's still working, the page shows **"Analyzing your results"** — refresh or wait a moment and the full report renders.
## Reading the Report Page
| Section | What it tells you |
| :- | :- |
| Stat cards | Coverage at a glance — **Total API Tested** (backend) or **Base URL** (frontend), **Total Features**, **Total Test Cases** |
| Pass distribution | A donut of **passed / failed / blocked** — your pass rate and where the failures sit |
| Test Summary | A plain-English narrative of how the run went, written by the analysis |
| Fix prompt | A copy-paste prompt for your coding agent (see below) |
| Issues found | Failed and blocked tests **grouped by root cause**, so ten failures from one bug read as one issue |
| What could be better | Concrete weaknesses the analysis spotted |
| Recommendations | Suggested next steps |
The report is built around **outcomes and coverage** — pass/fail/blocked counts and how many features and cases were tested — rather than timing. For when a run happened and how recent it is, use the **Test Runs** history (each run is timestamped); the downloadable PDF also prints a "Saved By TestSprite" time estimate on its cover.
## The AI Fix Prompt
The **Fix prompt for your coding agent** card holds a ready-to-paste prompt that enumerates every concrete problem the run found and what to change. Click **Copy prompt** and paste it into Claude Code, Cursor, or any LLM agent pointed at your repo.
The report is generated from an AI **analysis pass** that runs automatically when a run finishes. While it's still working, the page shows **"Analyzing your results"** — refresh or wait a moment and the full report renders.
## Reading the Report Page
| Section | What it tells you |
| :- | :- |
| Stat cards | Coverage at a glance — **Total API Tested** (backend) or **Base URL** (frontend), **Total Features**, **Total Test Cases** |
| Pass distribution | A donut of **passed / failed / blocked** — your pass rate and where the failures sit |
| Test Summary | A plain-English narrative of how the run went, written by the analysis |
| Fix prompt | A copy-paste prompt for your coding agent (see below) |
| Issues found | Failed and blocked tests **grouped by root cause**, so ten failures from one bug read as one issue |
| What could be better | Concrete weaknesses the analysis spotted |
| Recommendations | Suggested next steps |
The report is built around **outcomes and coverage** — pass/fail/blocked counts and how many features and cases were tested — rather than timing. For when a run happened and how recent it is, use the **Test Runs** history (each run is timestamped); the downloadable PDF also prints a "Saved By TestSprite" time estimate on its cover.
## The AI Fix Prompt
The **Fix prompt for your coding agent** card holds a ready-to-paste prompt that enumerates every concrete problem the run found and what to change. Click **Copy prompt** and paste it into Claude Code, Cursor, or any LLM agent pointed at your repo.
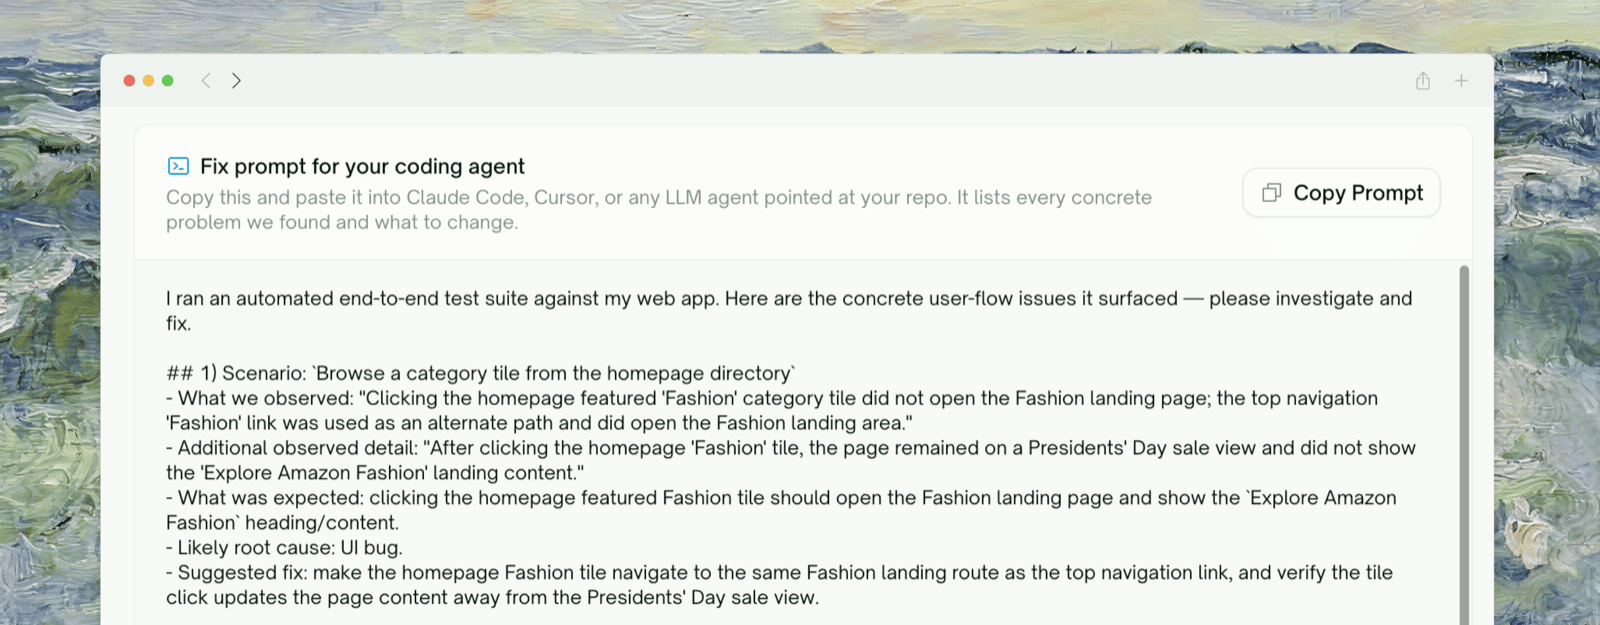 The prompt is generated by the same analysis that writes the summary, so it reflects the actual failures in this run. When there are no actionable issues, the card is empty.
The same copy-a-fix-prompt idea appears in two other places: the [Triage Queue](/web-portal/results/project-overview) on Insights, and (for one failing test at a time) the [Step-by-Step](/web-portal/core/ui/ui-step-by-step) failure detail.
## Downloading the PDF
The PDF is a fuller, print-ready rendering of the same execution — with a cover, a table of contents, coverage tables, and per-failure detail including source code. It's produced through your browser's print dialog rather than as a server file, so the export step matters.
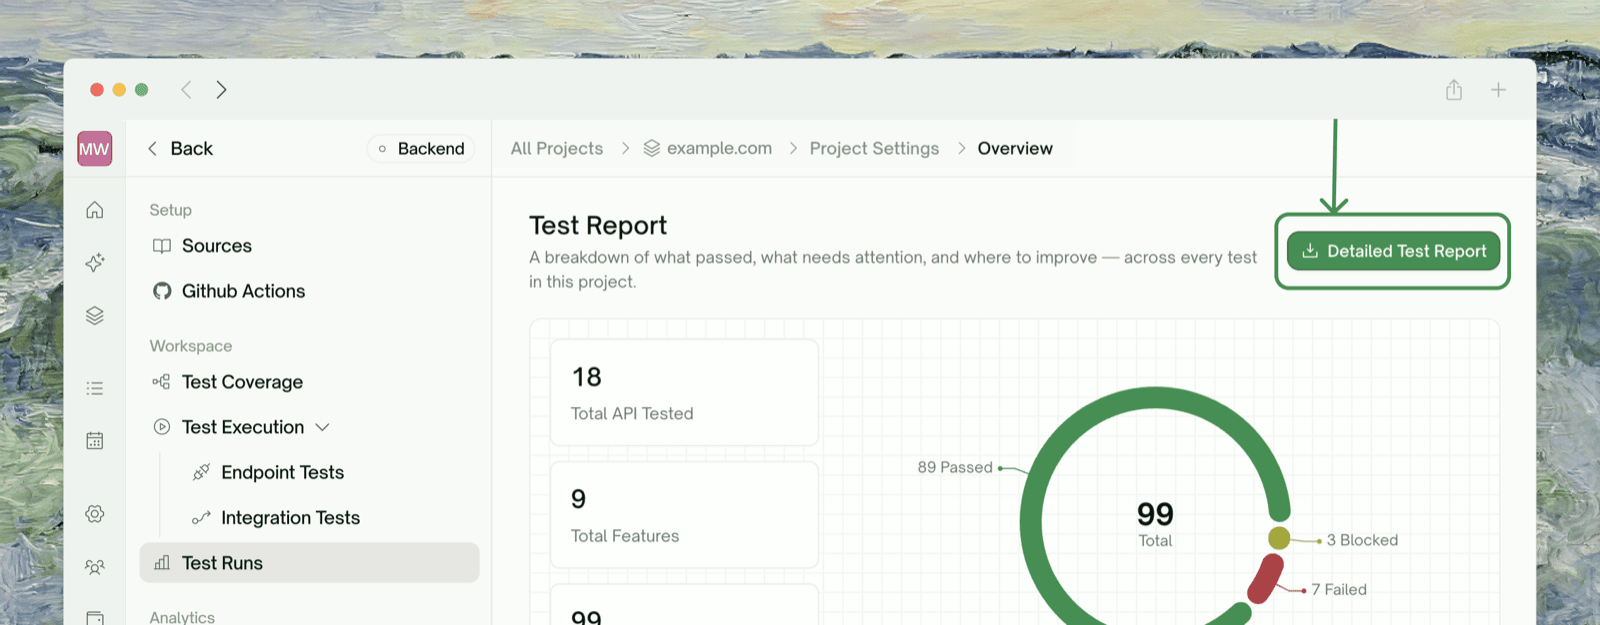
On the report page, click Detailed Test Report. A new tab opens and assembles the full report.
The prompt is generated by the same analysis that writes the summary, so it reflects the actual failures in this run. When there are no actionable issues, the card is empty.
The same copy-a-fix-prompt idea appears in two other places: the [Triage Queue](/web-portal/results/project-overview) on Insights, and (for one failing test at a time) the [Step-by-Step](/web-portal/core/ui/ui-step-by-step) failure detail.
## Downloading the PDF
The PDF is a fuller, print-ready rendering of the same execution — with a cover, a table of contents, coverage tables, and per-failure detail including source code. It's produced through your browser's print dialog rather than as a server file, so the export step matters.
On the report page, click Detailed Test Report. A new tab opens and assembles the full report.
 The page shows a **Generating** spinner while it lays out every section. Wait for it to settle before printing.
When the print dialog opens, choose **Save as PDF** as the destination and match these settings so the report renders correctly:
| Setting | Value |
| :- | :- |
| Background graphics | On |
| Margins | None |
| Scale | 100% |
Save. You now have a self-contained PDF to share or archive.
The PDF is generated client-side by your browser's print-to-PDF. There is no separately-stored PDF file on the server — regenerate it any time from the same button.
## What's in the PDF
| Section | Contents |
| :- | :- |
| Cover | Date, report title, a contents list, and four headline tiles — **Test Runs**, **Pass Rate**, **Issues**, **Saved By TestSprite** (an estimate of engineering time saved) |
| Table of Contents | Two-level outline of the report |
| Executive Summary | A **High-Level Overview** table (project, type, totals, pass/fail/blocked) plus **Key Findings** — the Test Summary, What could be better, and Recommendations |
| Coverage | Per-type detail — backend endpoint/integration coverage, or frontend UI coverage |
| Failure detail | For each **failed or blocked** test: status, priority, description, a preview link, the error / cause / fix, and the test's source code |
The failure-detail section covers **failed and blocked tests only** — passing tests aren't itemized. That keeps the report focused on what needs attention and makes it a natural artifact to attach to a bug review or release sign-off.
### Who it's for
* **PMs and leadership** — the cover tiles and executive summary give the run's outcome and headline findings without reading test code.
* **Release records** — attach the PDF to a release or sign-off so there's a durable, self-contained record of what was tested and what passed.
* **Engineers** — the per-failure detail (error, cause, fix, source) is enough to start debugging straight from the document.
## Generation & Retention
* **Generated automatically** when a run completes — the analysis pass runs on completion, and the report/PDF render on demand from the stored result. No manual "generate report" step.
* **No fixed expiry** on the report itself: it lives with the execution record and re-renders whenever you open it. The time-limited pieces are the embedded media links — screenshots are signed for roughly a week — so download the PDF if you need a permanent copy with images intact.
## Where to Go Next
See results build up before the run finishes
The triage queue and quality trends across runs
Localize a single UI failure action by action
The full page behind a single test
This documentation is built and hosted on [Mintlify](https://mintlify.com), a developer documentation platform.
The page shows a **Generating** spinner while it lays out every section. Wait for it to settle before printing.
When the print dialog opens, choose **Save as PDF** as the destination and match these settings so the report renders correctly:
| Setting | Value |
| :- | :- |
| Background graphics | On |
| Margins | None |
| Scale | 100% |
Save. You now have a self-contained PDF to share or archive.
The PDF is generated client-side by your browser's print-to-PDF. There is no separately-stored PDF file on the server — regenerate it any time from the same button.
## What's in the PDF
| Section | Contents |
| :- | :- |
| Cover | Date, report title, a contents list, and four headline tiles — **Test Runs**, **Pass Rate**, **Issues**, **Saved By TestSprite** (an estimate of engineering time saved) |
| Table of Contents | Two-level outline of the report |
| Executive Summary | A **High-Level Overview** table (project, type, totals, pass/fail/blocked) plus **Key Findings** — the Test Summary, What could be better, and Recommendations |
| Coverage | Per-type detail — backend endpoint/integration coverage, or frontend UI coverage |
| Failure detail | For each **failed or blocked** test: status, priority, description, a preview link, the error / cause / fix, and the test's source code |
The failure-detail section covers **failed and blocked tests only** — passing tests aren't itemized. That keeps the report focused on what needs attention and makes it a natural artifact to attach to a bug review or release sign-off.
### Who it's for
* **PMs and leadership** — the cover tiles and executive summary give the run's outcome and headline findings without reading test code.
* **Release records** — attach the PDF to a release or sign-off so there's a durable, self-contained record of what was tested and what passed.
* **Engineers** — the per-failure detail (error, cause, fix, source) is enough to start debugging straight from the document.
## Generation & Retention
* **Generated automatically** when a run completes — the analysis pass runs on completion, and the report/PDF render on demand from the stored result. No manual "generate report" step.
* **No fixed expiry** on the report itself: it lives with the execution record and re-renders whenever you open it. The time-limited pieces are the embedded media links — screenshots are signed for roughly a week — so download the PDF if you need a permanent copy with images intact.
## Where to Go Next
See results build up before the run finishes
The triage queue and quality trends across runs
Localize a single UI failure action by action
The full page behind a single test
This documentation is built and hosted on [Mintlify](https://mintlify.com), a developer documentation platform.