

Runs Are Watchable, Not Just Reported
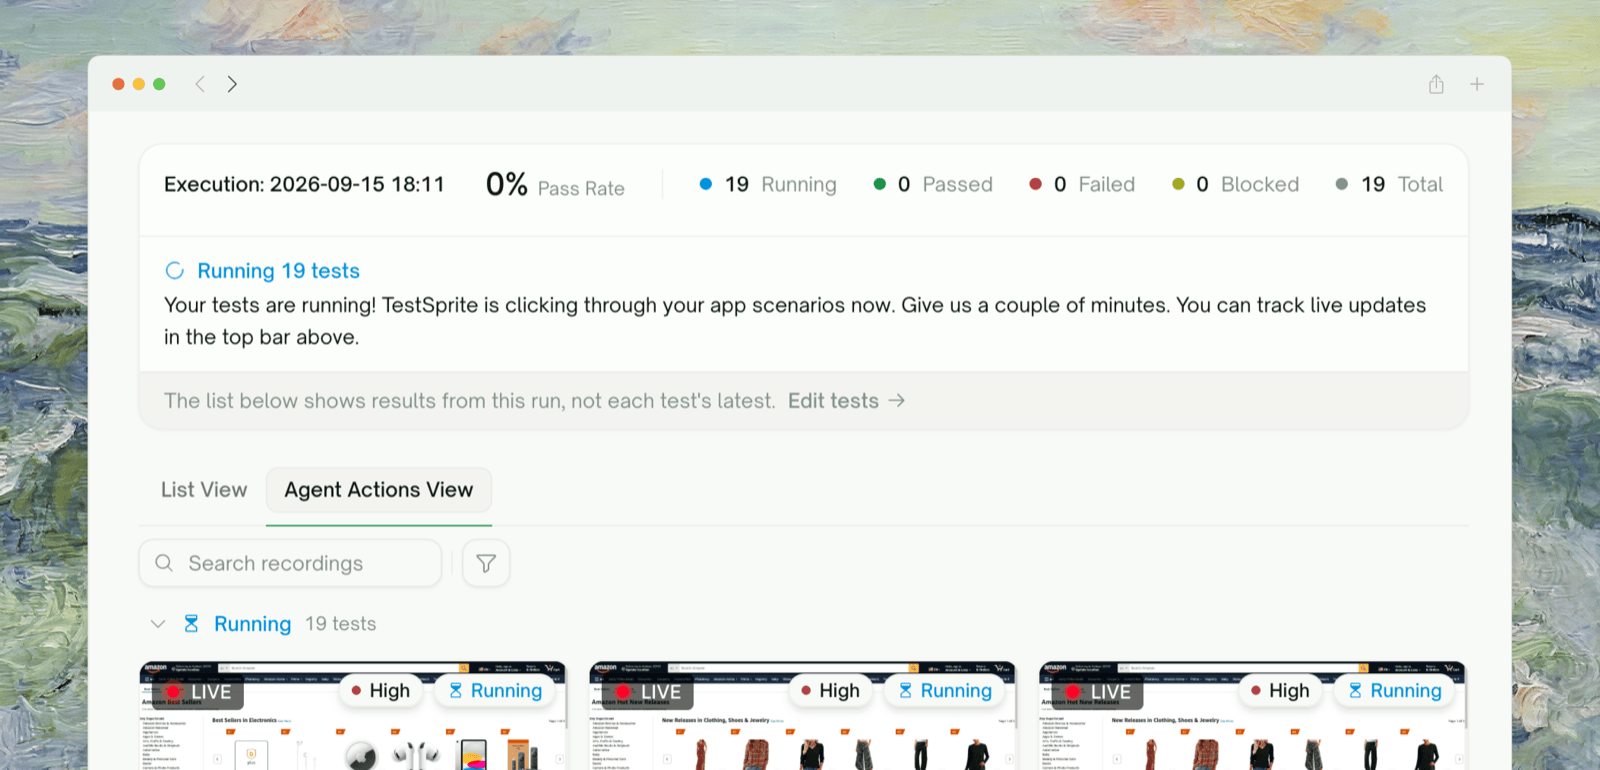
When you start a UI run, you don’t have to wait for it to finish to see anything. TestSprite streams the run as it happens: each test shows up as a live view of the agent driving your app, the counts at the top tick up in real time, and you can open any test to watch its steps land one by one. This page is about the in-flight experience — while tests are still running. For the finished-run summary, see Test Report.The Run Report Header
At the top of the run page, a Run Report panel summarizes the run as it progresses. While tests are still going, it shows a Running outcome and a live count breakdown:
The numbers refresh automatically every couple of seconds — no need to reload.
The report reflects this run, not each test’s latest status. A blue banner notes: “The list below shows results from this run, not each test’s latest.” If you re-ran a subset, the numbers here are scoped to the run you’re watching.
Two Ways to Watch: Agent Actions View vs. List View
The run page has two tabs. They show the same run two different ways, and each is better for a different question.
Switch between them anytime with the tab bar — you’re never locked into one. Both share the same live Run Report header.
Agent Actions View (the live agent view)
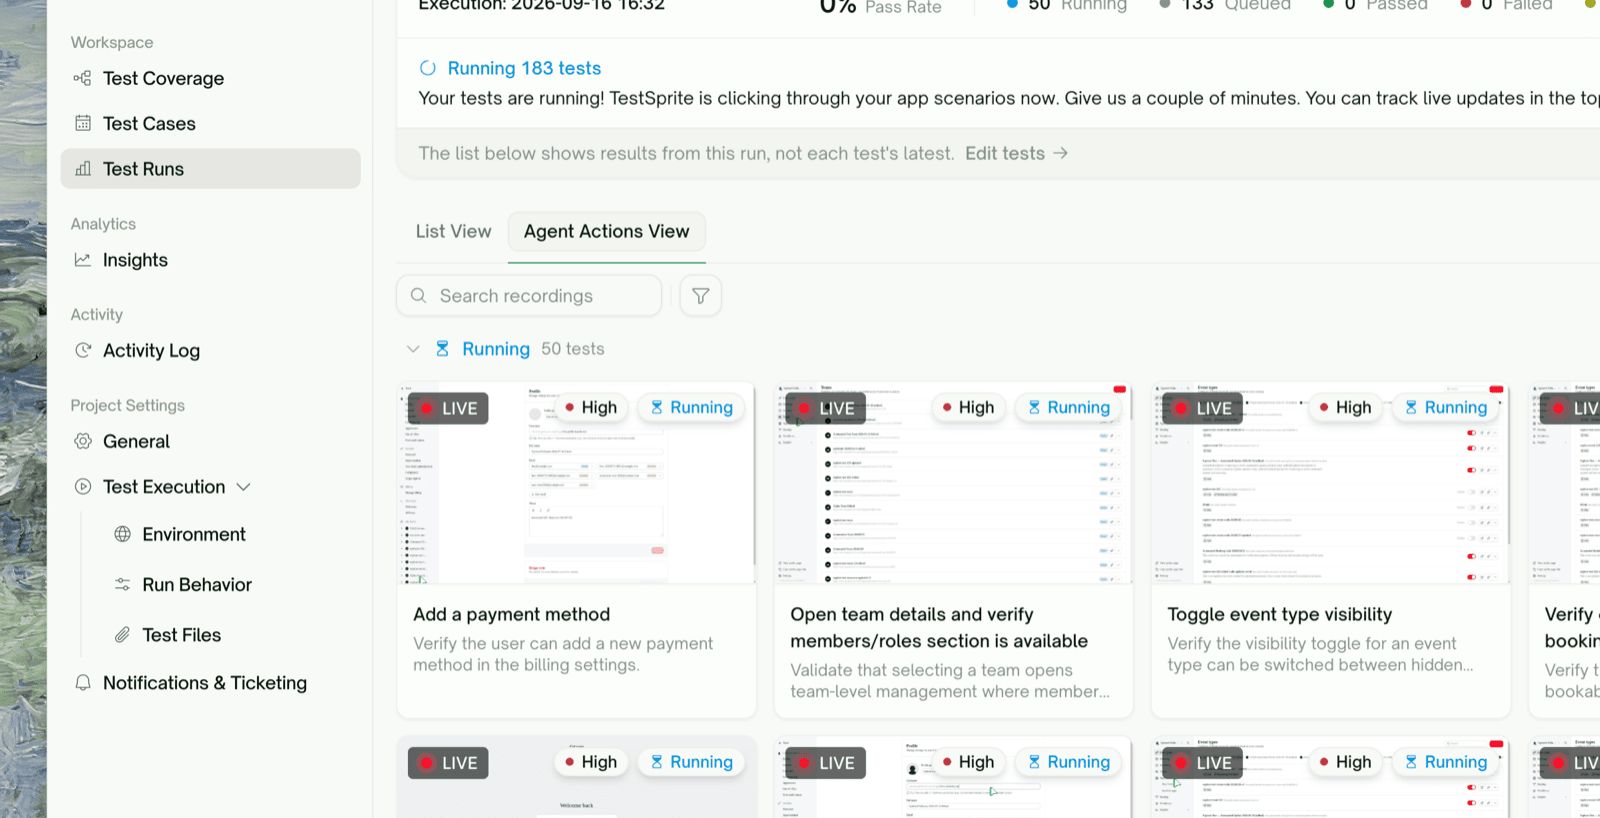
- Running tiles show the live stream (starting with “Starting…” until the first frame arrives).
- Search recordings and filter by status or priority to focus.
- Empty state while warming up: “Recording agent runs — AI agents record every test run; tiles appear here as recordings land.”
Queued tests don’t appear as tiles yet. A test that hasn’t started has nothing to stream, so it joins the gallery the moment it begins running.
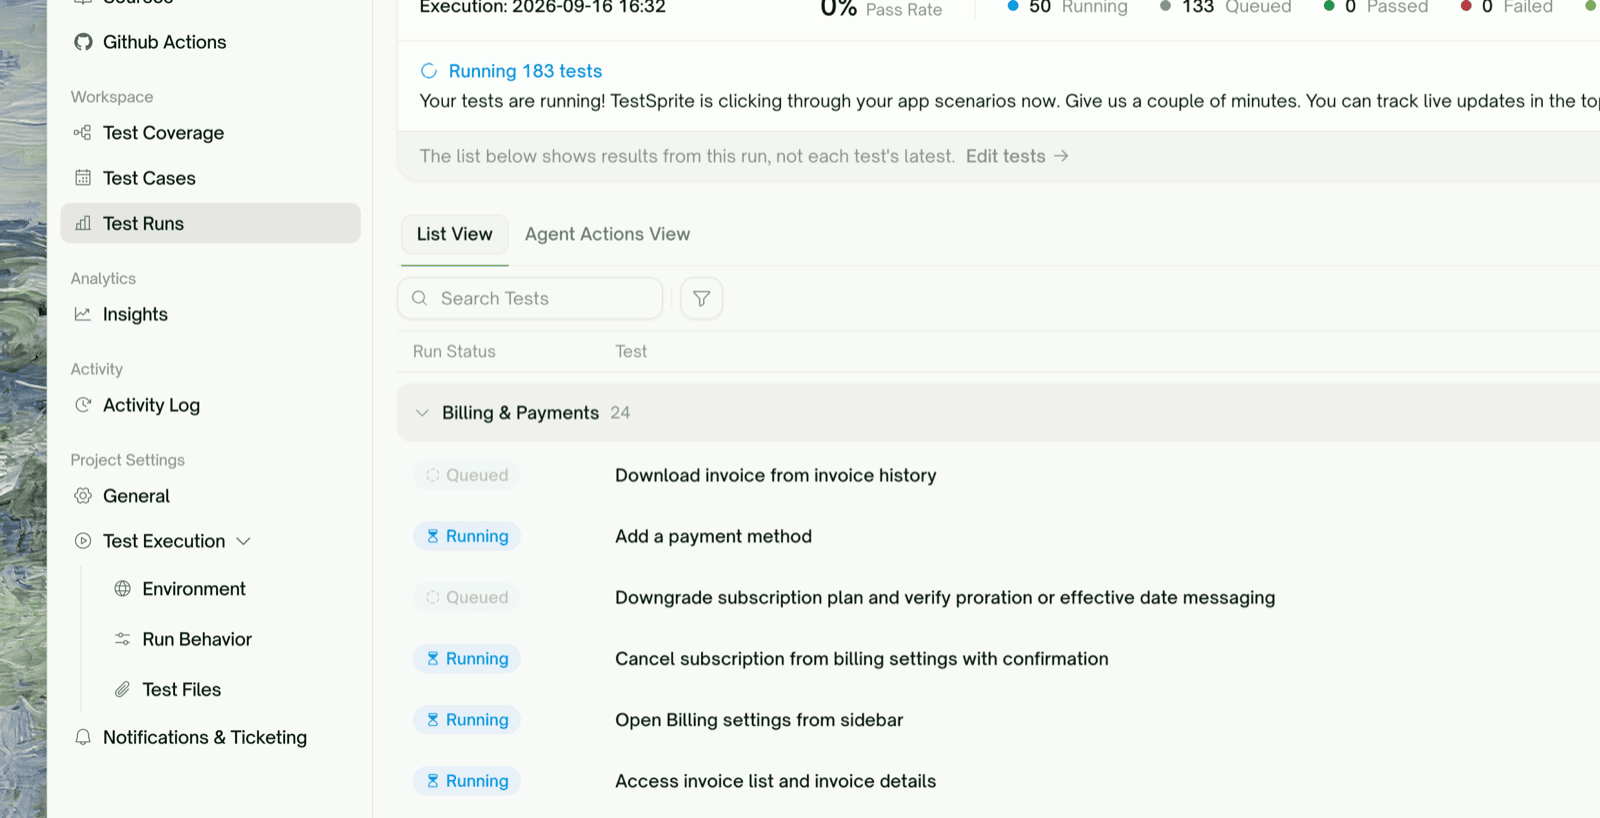
List View (the results table)
Reading Real-Time Step Snapshots
Open any test — a row in List View, or a tile in Agent Actions View — and you get a live, per-step view of what the agent is doing inside that one test.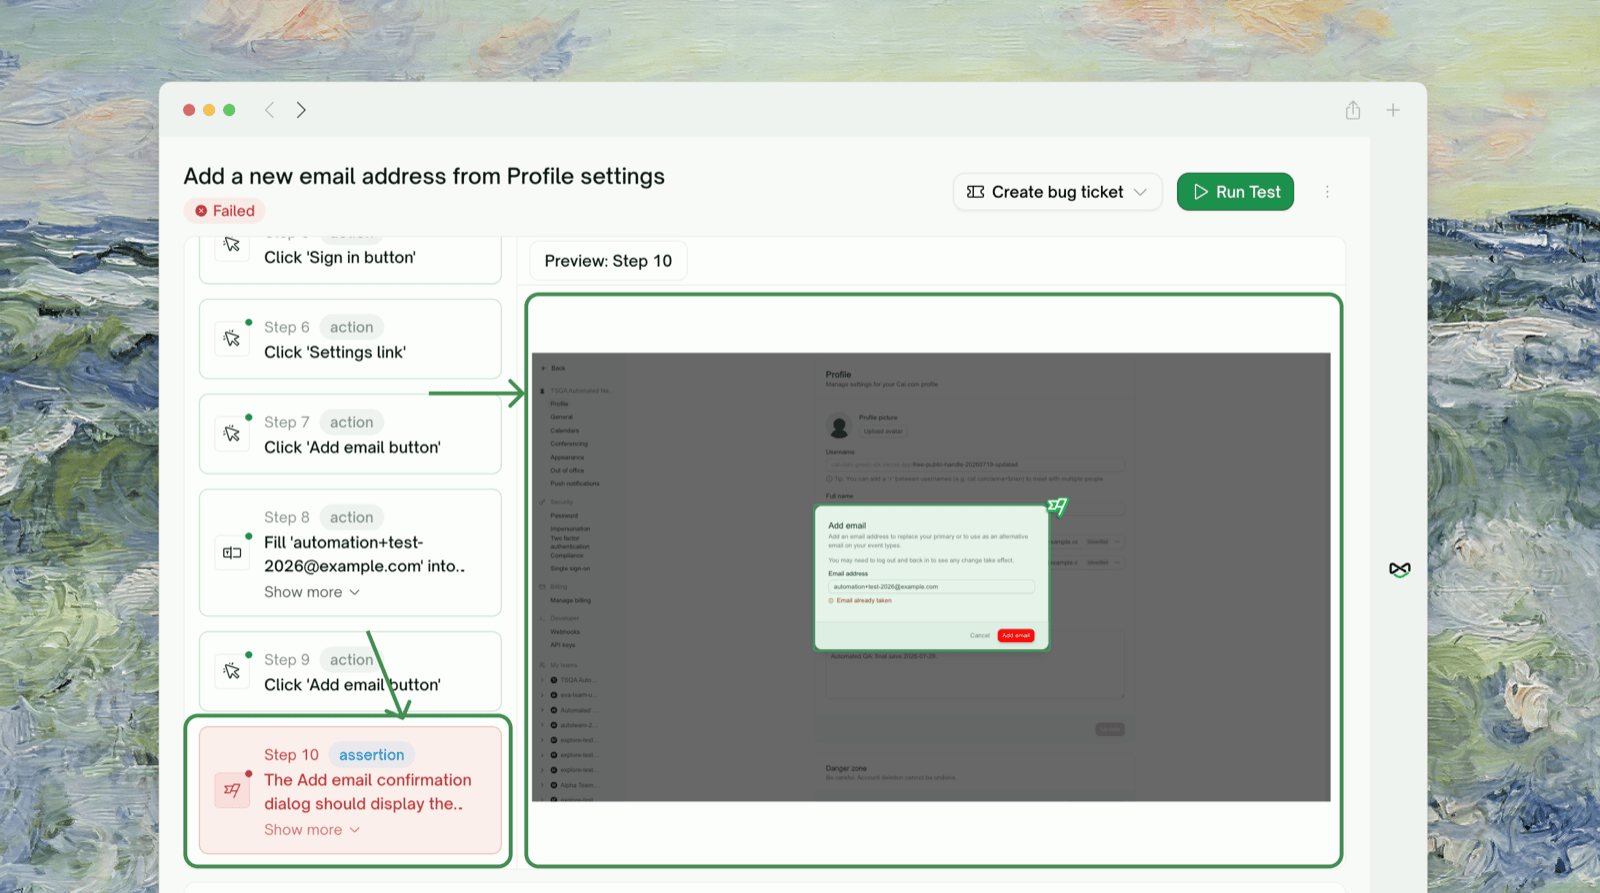
The live step list
Inside the test detail, the Execution Steps section fills in as the agent acts:The per-step snapshot
Click any step and the right pane shows an HTML snapshot of the page at that moment (header “Preview: Step N”) — the actual DOM the agent saw, not a screenshot. This is how you localize where a run started going wrong, step by step. Alongside the steps, the Preview tab shows the same live agent stream for that test while it’s running (placeholder: “Test in progress. Results will appear here when it completes.”), so you get both the step-by-step trace and the live browser view in one place.Snapshots and steps update by polling, every couple of seconds. There’s a slight lag between what the agent does and what you see — this is normal. If a snapshot looks blank, the page hadn’t settled when that frame was captured; the next step usually shows the stable state.
How the Live View Works (and Its Limits)
A few things worth knowing so the behavior doesn’t surprise you:The live view is a frame stream, not smooth video
The live view is a frame stream, not smooth video
While a test runs, the preview is a stop-motion stream of the agent’s browser — frames refreshed about once a second — not full-motion video. It’s meant to show you what the agent is doing, not to be a perfect screen recording. The polished, seekable video is produced once the test finishes.
Everything updates by polling, so expect a small lag
Everything updates by polling, so expect a small lag
Counts, step lists, and snapshots refresh every 2–3 seconds. If something doesn’t seem to update, give it a moment or refresh the page — the run is still progressing server-side; only the live view hiccupped.
A running tile shows LIVE; a Queued test shows nothing yet
A running tile shows LIVE; a Queued test shows nothing yet
Running = the browser session for that test is live (you’ll see the LIVE badge and the frame stream). Queued = accepted but not started — nothing to watch until it begins. On paced runs, tests move from Queued to Running in batches.
Re-run all / Re-run failed are disabled while a run is in progress
Re-run all / Re-run failed are disabled while a run is in progress
You can’t kick off another full run on top of an in-flight one. Wait for the current run to finish; the rerun buttons re-enable when the project is idle.
Where to Go Next
Test Report
The run summary once everything finishes
Step-by-Step Walkthrough
Replay a finished test action by action
Agent Actions
The full recording gallery for a project
Rerun
Re-execute a test or the whole project after you’ve triaged