

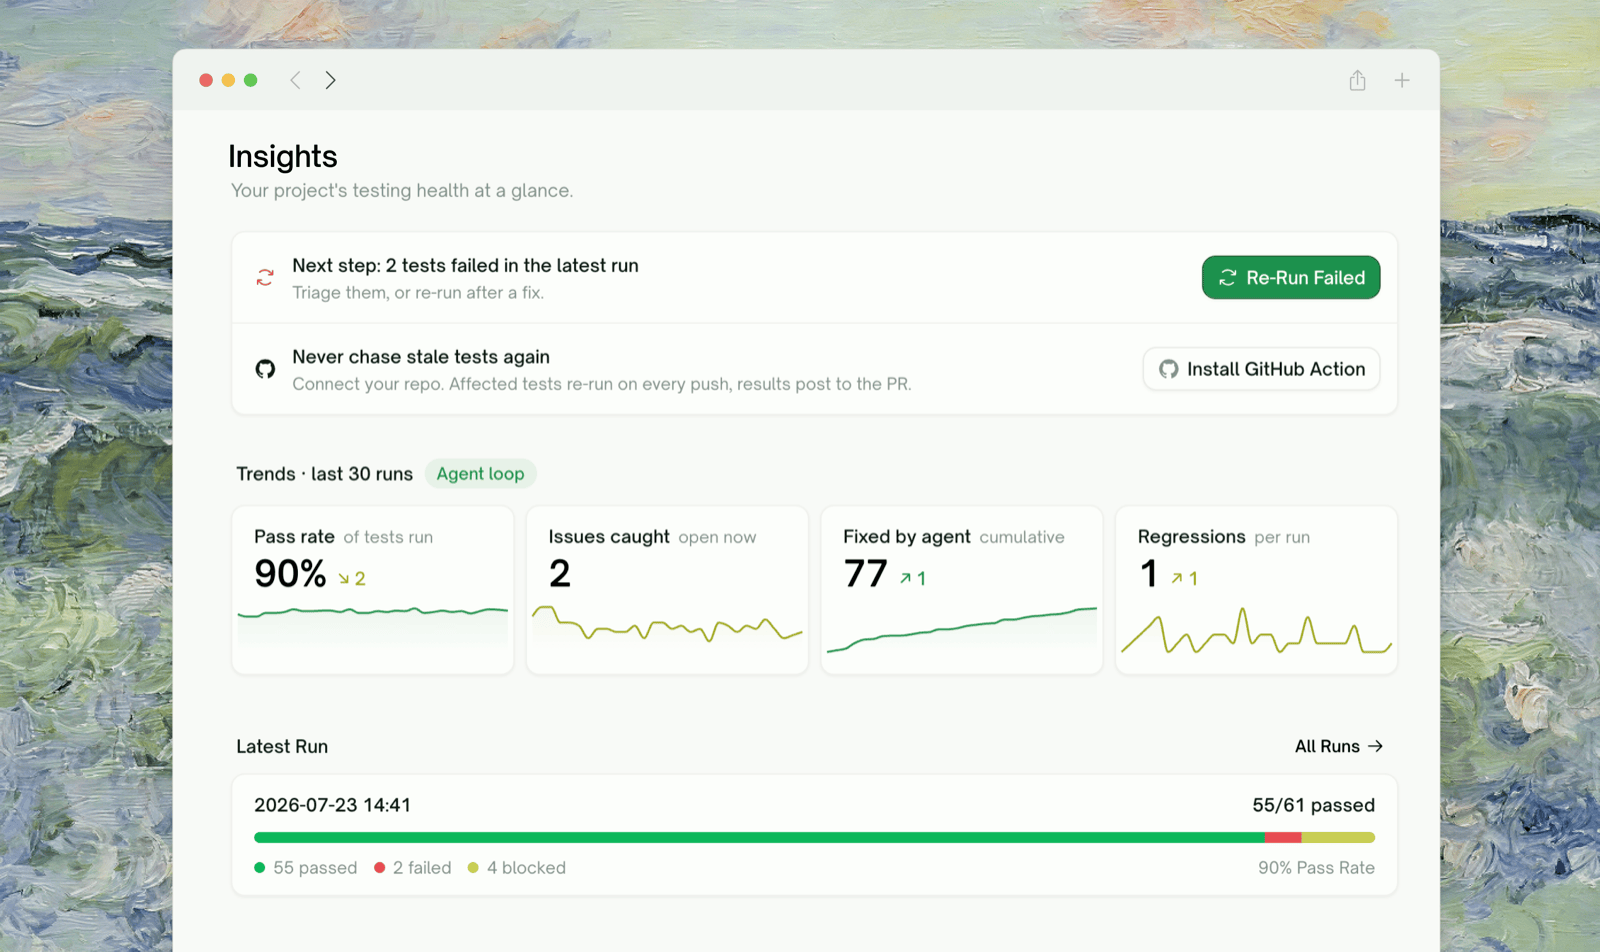
How to Read This Page
At the top, TestSprite also shows contextual prompts when they apply, such as “We noticed changes in your repo” with a Re-run all tests button when your code has moved since the last run, or a suggestion to enable the GitHub Action for a connected repo.
Issues to Fix (Triage Queue)
The queue lists every test case whose latest result is failed or blocked, but one row is one root cause, not one test. Failures with the same diagnosis (same HTTP status and error signature) are clustered, so a single backend bug that breaks eight tests shows up as one row tagged “8 tests”. How it’s sorted: failed groups above blocked ones, then groups containing a regression, then the largest cluster (one fix clears the most tests). Blocked tests are collapsed behind a “Blocked · N tests that could not run” toggle so they don’t bury real failures.
Clearing the queue:
- Expand the top row to see the Suggested fix and the affected tests. Click any test pill to open its detail drawer without leaving the page.
- Decide whether it’s a real bug, a flaky test, or a stale test. New points at a regression, Flaky at instability; for anything ambiguous, check the test’s history in its detail view.
- Act, then re-run. For product bugs, click Copy Fix Prompt at the top of the card to copy a prompt covering every group in the queue (diagnosis, endpoint, response, suggested fix, affected tests), and paste it into your coding agent. After a fix, or for suspected flakes, click the row’s Re-run button to re-run every affected test at once.
Quality Trends
The Trends widget plots one point per run (up to the last 50 runs, not calendar time) across four metrics. Each card shows the current value, a sparkline, and a delta arrow vs. the previous run (green means moving the right way):
Common patterns:
- Failing several runs in a row: likely a real regression. Check what changed around the first failing run (the Activity Log helps).
- Alternating pass / fail: a flaky test or unstable environment, not a product bug. These also get the Flaky badge.
- Sudden drop across many tests at once: usually an environment or authentication problem rather than many simultaneous bugs.
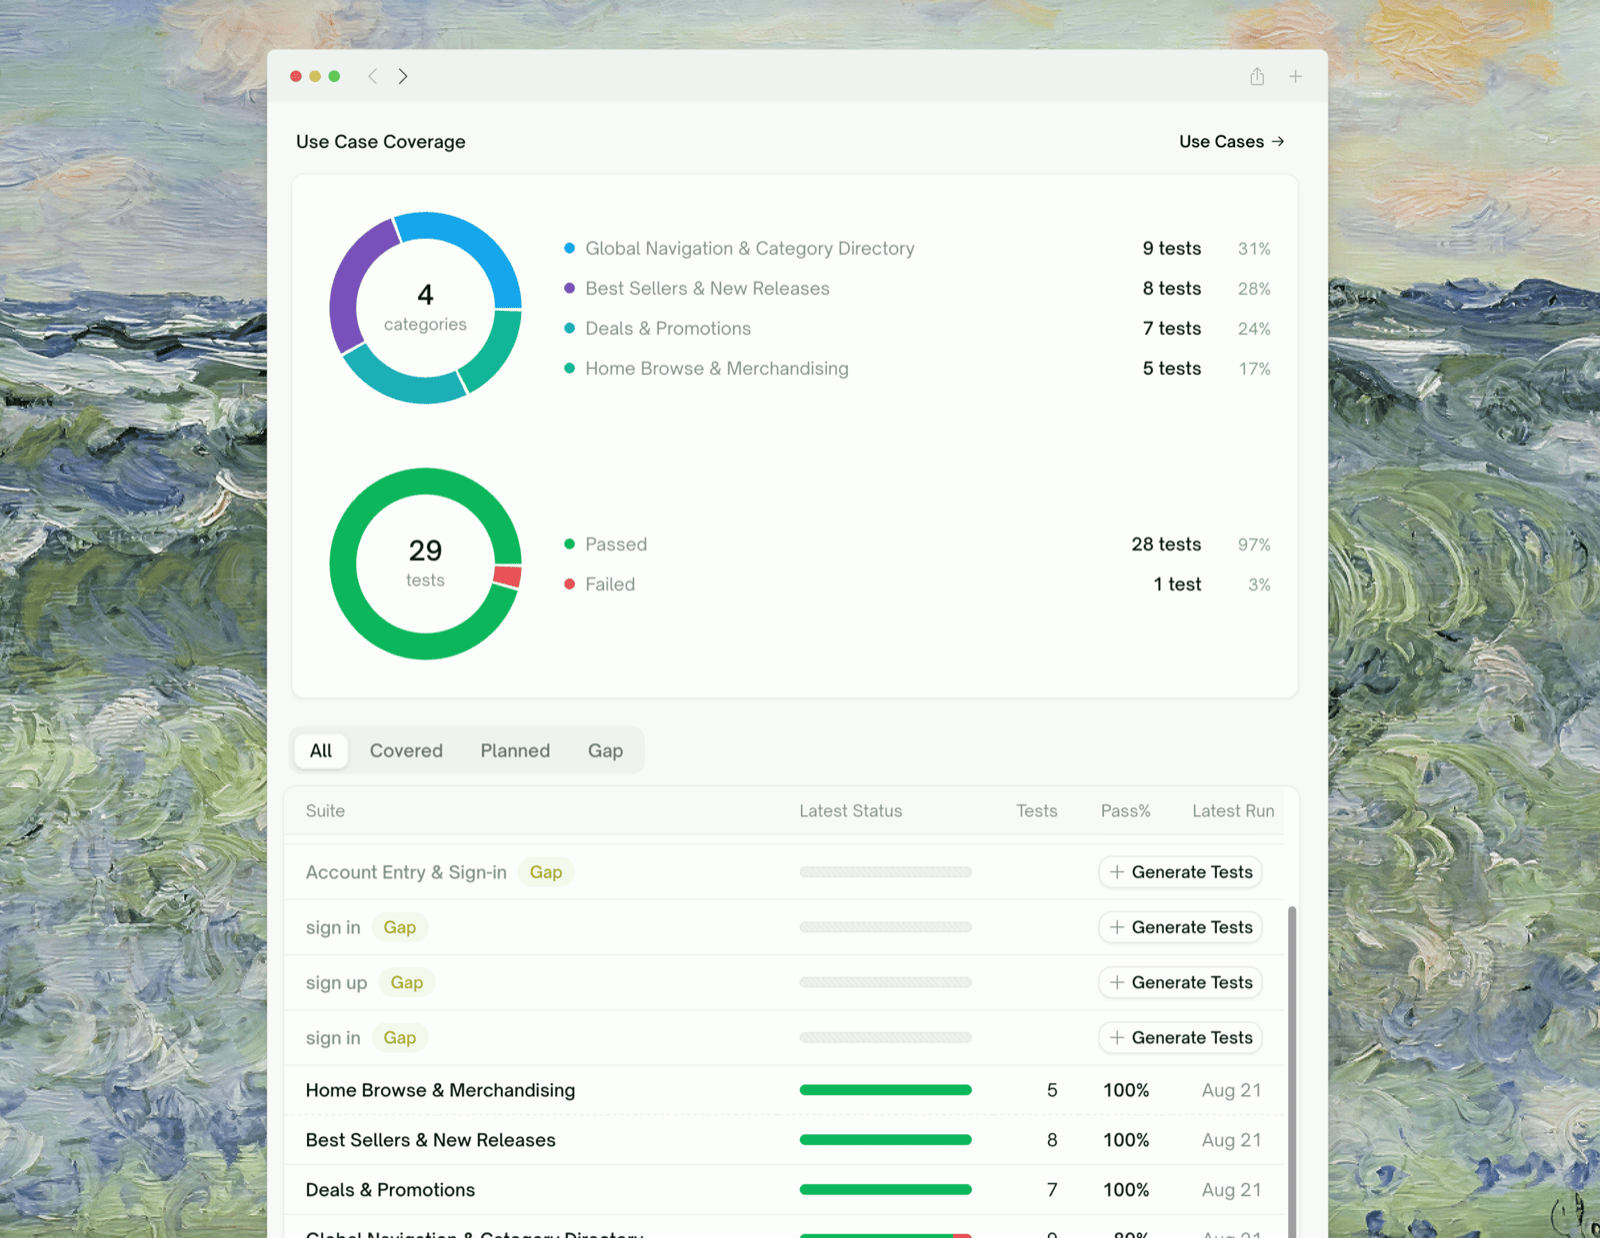
Use Case Coverage
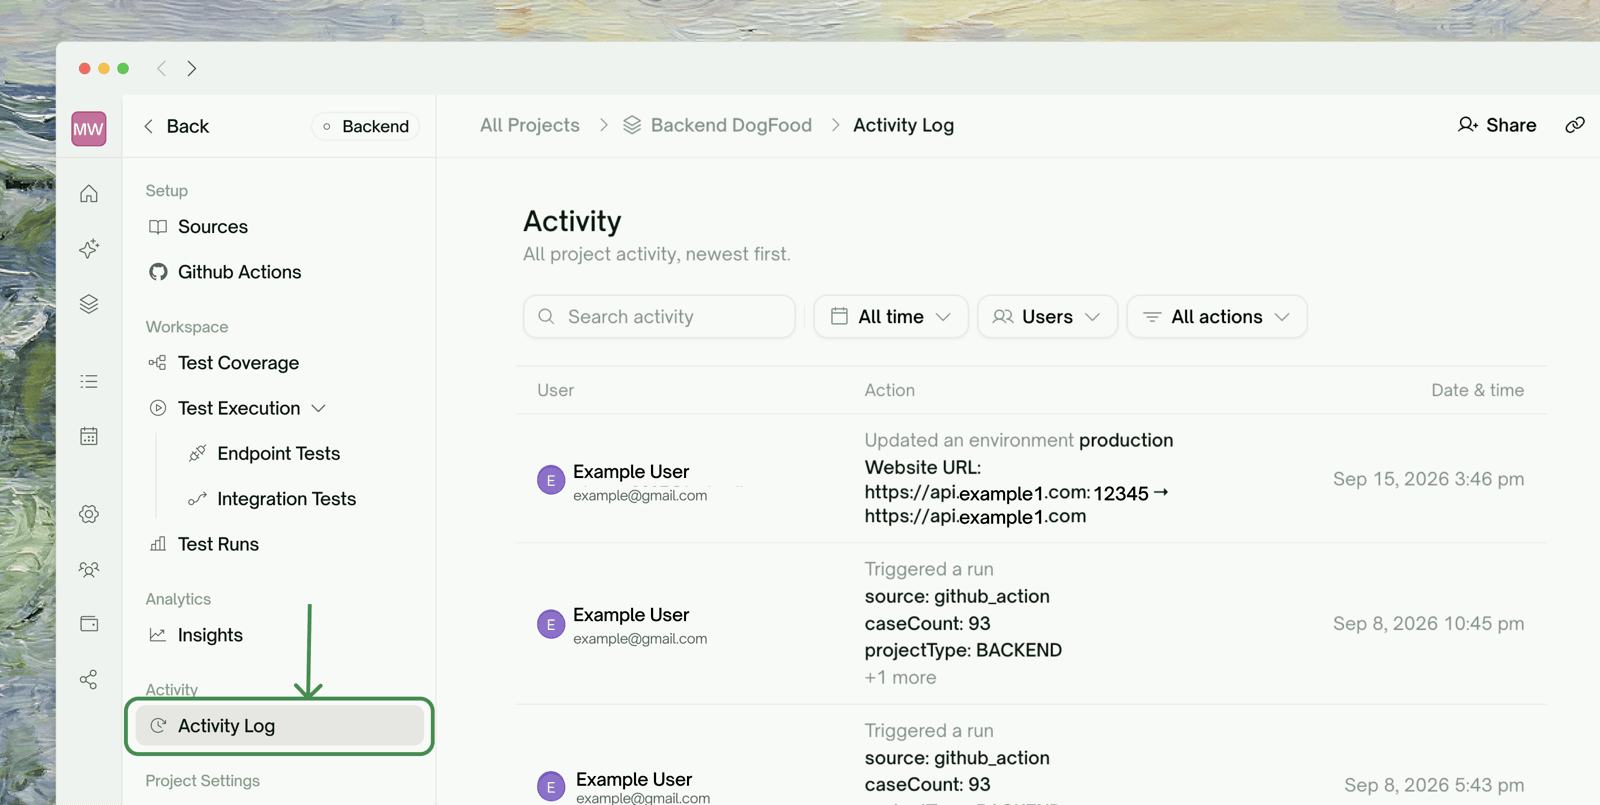
Project Activity Log
Suggested Workflow: Weekly Quality Review
- Clear the triage queue: walk Issues to Fix top to bottom; the sorting already puts the highest-leverage fix first.
- Read the Trends deltas: a falling pass rate or rising regressions is the week’s headline.
- Scan Use Case Coverage: assign any Gap rows before the next release.
- Skim the Activity Log: confirm nothing unexpected changed (tests deleted, schedules paused).
Where to Go Next
Test Report & Export
Download a shareable PDF report for any run
Rerun
Re-run a single test, a failure group, or the whole project